Why Daylighting: As an (electrical) lighting designer, daylighting is exciting to me for a lot of reasons. There are energy conservation reasons, of course–40% of the electricity consumption in commercial spaces is lighting, and daylight harvesting is a mostly untapped method of reducing that sum. There is evidence that a connection to the outside world is beneficial to the happiness and productivity of the occupants, such as the research conducted by the Heschong Mahone Group on classrooms and commercial office spaces. And, artistically, there’s a tremendous potential to create dynamic sculptures using the sun and building form, and to contribute to the narrative of the architecture.
Know your sDA from your aSE: I just got back from attending the Daylighting Institute at the 2012 Lightfair, which if you have a chance to go is really worth your time. As the LEED sustainable building program becomes the default for high-profile projects, it is pushing daylighting design from the provenance of academic research and a few specialty firms out into the mainstream of standard architectural practice.
Many of the seminars this year revolved around the various daylighting metrics available, whether moment-in-time based metrics such as that found in LEED 2.2, to dynamic metrics such as daylight autonomy (DA), useful daylight illuminace (UDI), and spatial daylight autonomy (sDA). I thought a quick reference guide to the various ways of measuring daylight within the space, with examples, might come in handy for people like myself that are trying to get a handle on all this. The metrics are in approximate order of how established they are within the design community, with metrics that are still under active development like Spatial Daylight Autonomy towards the end. I’ve also created a generic example space to help explain the concepts.
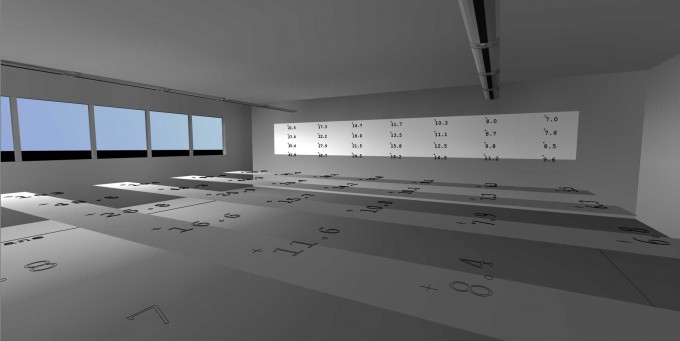
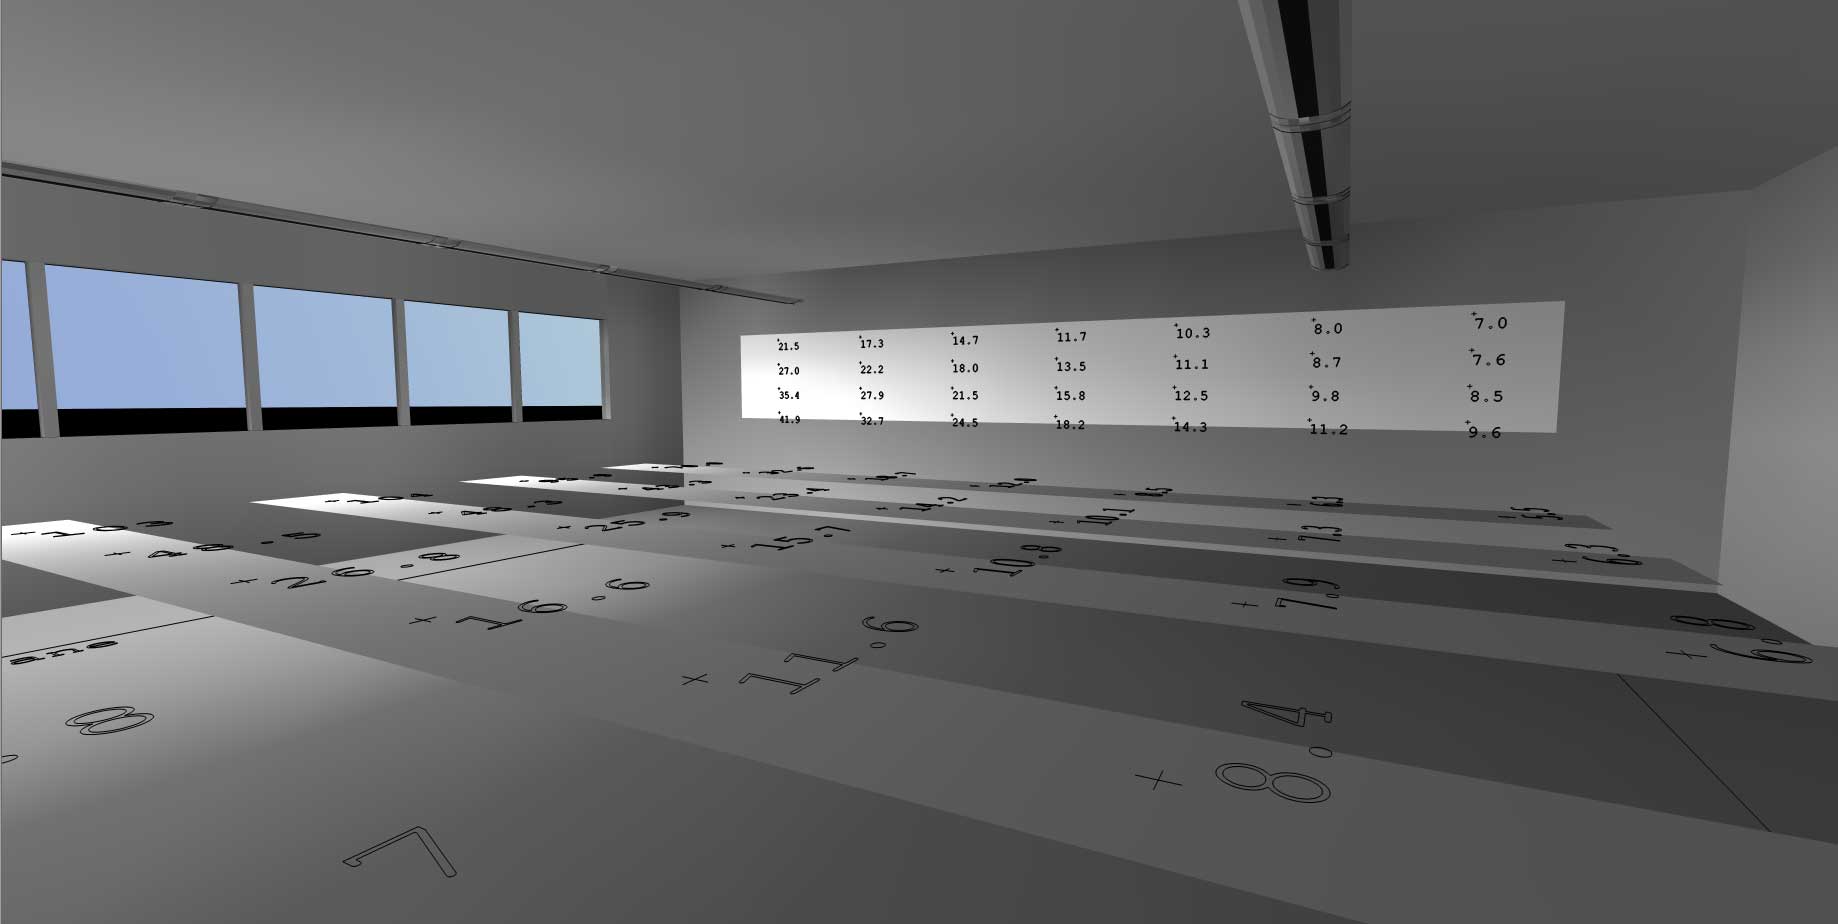
For purposes of visualization, the above space a 32’x32′ classroom, with a large window along one wall. While I’ll be referring to this as a classroom, I wanted results that are generally applicable as a basis of comparison, so I have excluded federal holidays from the occupancy profile, but not the summer and winter holidays and the like. Maybe a lot of kids get detention in this particular class :)
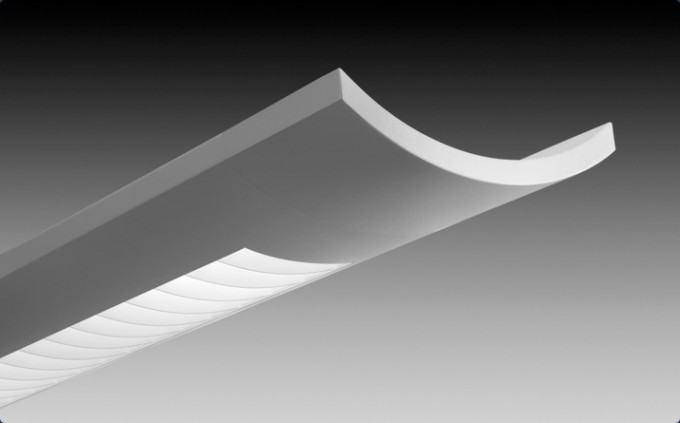
The reflectances are the typical 80% ceiling, 50% walls, and 20% floors. I am using the Focal Point Verve IV with two outboard up/down lamps and a center downlight lamp for multimedia presentations, along the line of what the Collaborative for High Performing Schools (CHPS) recommends (only the outboard lamps are on for purposes of calculations). In other words, it’s a typical classroom lighting setup.
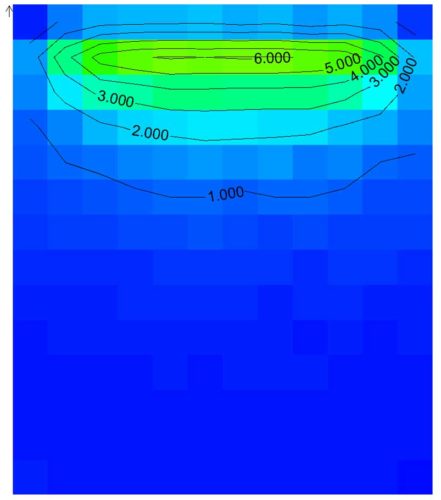
Daylight Factor (DF): The ratio of internal illuminances to exterior illuminances, under a CIE overcast sky. For example, if you have 2,000 fc exterior, and 20fc average interior, that’s a 2% DF. This is the earliest standard of daylighting, developed as a legal basis in 19th century Britain for determining when a new structure would intrude on the daylighting of another. A DF greater than 2% is considered adequate, 2-5% is considered well daylit.
Pros:
- It actually works pretty well if you are somewhere with prevailing foggy or cloudy conditions, such as, well, London for example.
- Simple to calculate and can be generated without any additional effort in AGI32.
Cons:
- DF gives the same results independent of orientation, time of day, and climate. So for a north-facing window in a foggy climate, it would be of some use, whereas for a western exposure in Phoenix, it would give *very* inaccurate results.
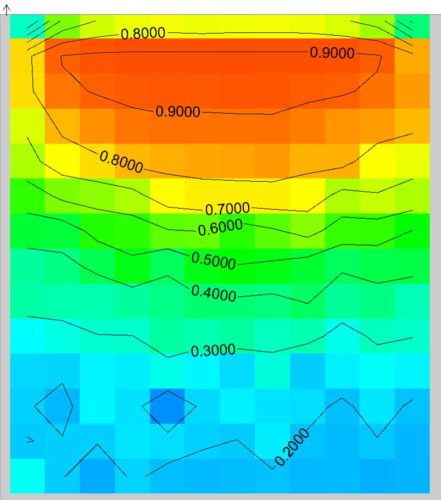
Our example: Daysim unfortunately doesn’t give calculation summaries, but AGI gives us 2% total for the space. You can see the distribution above. So that would be considered acceptably daylit. However, looking at the distribution of daylight factor percentage from Daysim above, supplementary electric lighting would be needed for the row of fixtures furthest from the window on almost every day.

LEED 2009, Prescriptive Method: Calculate the ratio of window area (above 30″) to floor area and multiply by the visible light transmittance (VLT). Achieve a value between .150 and .180.
.150 < VLT * WFR < .180
I mention this only in passing because it’s not really a design tool so much as a LEED compliance metric, but our floor area is 32×32 = 1120 sq. ft., the window surface area is 96 sq. ft., giving a Window to Floor ratio (WFR) of .087. So unless there is a glass type that will transmit more light that it receives, this space would not qualify for LEED credits via the prescriptive method.
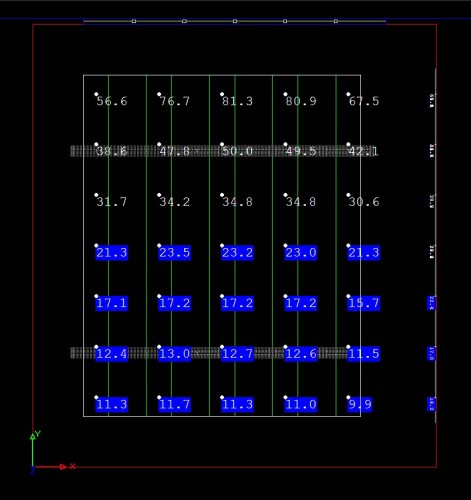
LEED 2009, Simulation Method: “Demonstrate through computer simulations that 75% or more of all regularly occupied spaces areas achieve daylight illuminance levels of a minimum of 25 footcandles (fc) and a maximum of 500 fc in a clear sky condition on September 21 at 9 a.m. and 3 p.m. Areas with illuminance levels below or above the range do not comply. However, designs that incorporate view-preserving automated shades for glare control may demonstrate compliance for only the minimum 25 fc illuminance level.”
Pros:
- I think if you want a pass-fail metric, this gives a lot of value relative to its fairly simple nature. There are a lot of high-performing daylit spaces that would not meet this metric, but you are probably doing more right than wrong if you do.
Cons:
- For most spaces, it’s very unlikely that you can get this LEED point without skylights.
- Automated shades, which would be necessary for most buildings with windows, are expensive and fussy to get working correctly.
- Since this is run under clear sky conditions, it’s more of a worst case scenario than typical of conditions at a given project site.
Our example: Calculated values for the different orientations (in AGI32) are as follows:
[table id=21 /]
So this space would not qualify for LEED points using either method.
Dynamic Metrics: the metrics after this point are dynamic, i.e. rather than simulating a few scenarios as typical, they take a weather file with hourly measurements of solar irradiances, and attempt to return a comprehensive result for the performance of the building over the course of a typical year.
For more on this subject, I highly recommend “Dynamic daylight performance metrics for sustainable building design” by Reinhart, Mardaljevic, and Rogers. This is probably a good time to say that this article does not represent original research on my part, I’m just summarizing notes from lectures I’ve attended on the subject along with other reading I’ve done.
Daylight Autonomy (DA): an annual analysis of the fraction of occupied time that the daylight levels exceed a specified target illuminance. So for every point in the space, what fraction of the time could an occupant work without supplemental electric lighting? Put another way, DA as a metric has three inputs: climate-based daylighting levels over an entire year, the actual hours of operation of the facility, and the specific desired lighting level.
Pros:
- DA gives an intuitive look at how well daylight will penetrate into the space.
- Good for determining which fixtures would benefit from automatic daylight harvesting.
- Takes into account the hours of actual operation and real weather conditions at the site.
Cons:
- Since there’s no upper limit on the allowed illuminance levels, poorly performing spaces with direct sunlight could do quite well on this metric. To put it another way, a glass box would have a DA of 1.0, but that wouldn’t be a very comfortable space to be in, as it would essentially be a greenhouse.
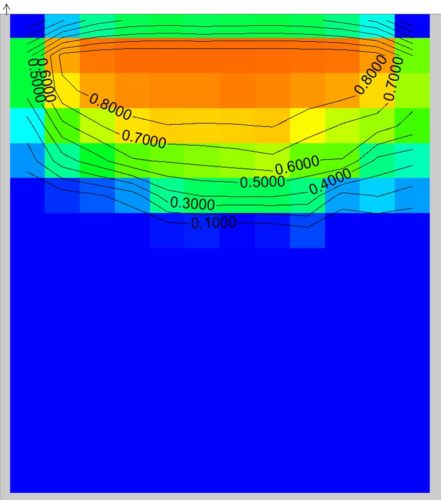
Our example: Daylighting is present under the first row of fixtures often enough that it might make sense to put them on a switching control as they’ll likely be off during all daylight hours and on during all occupied night hours. For the second row, it would appear that supplemental electric lighting would be needed during most of the day.
Continuous Daylight Autonomy (cDA): As per above, but partial credit is given for daylighting that is less than the target illuminance. For example, if your threshold value is 30fc, and you (somehow) have 15fc at a specific point 100% of operating hours, your cDA for that point would be .500
Pros:
- I think cDA is intended for use as a compliance metric more than a design tool. While a space that has enough daylight to reduce electric lighting loads would do pretty well on cDA, problem times and climate scenarios would not necessarily be apparent.
Cons:
- cDA is less suited for comparing two potential designs, because if you have .100 for an area, it’s not clear whether that’s because there were 30 fc 10% of the time, or 3fc 100% of the time, or what proportion in between.
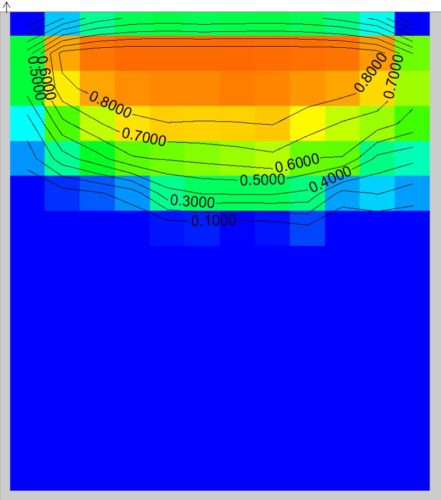
Our example: We can resolve that ambiguity above by comparing the cDA map against the DA map in the prior section. For example, in the side of the room nearest to the windows, the map looks about the same from DA to cDA, so when there *is* daylight, it’s sufficient for task lighting. Conversely, for the lower half away from the windows, there’s hardly ever light above 30fc as the DA map is solid blue, but there is pretty consistently a fraction of the necessary light, so dimming controls would be advantageous for that row of lighting.
Useful Daylight Illuminance (UDI): Another variation on Daylight Autonomy, UDI attempts to penalize for direct sunlight that falls into the space, on the theory that people will find this glary and distracting. UDI is a set of three numbers for every point in the space, the percentage of time that a point was below a minimum threshold, between a useful minimum and maximum value, and above a maximum value, which could result in glare or thermal discomfort. Often 10fc is used as the lower bound of useful illuminance, and 250fc on the upper bound.
Pros:
- Most of the advantages of DA, but an additional dimension for glare and thermal discomfort.
- Good for comparing the performance of two design variations.
- Since you’re generating three data points for every spatial point, it’s difficult to assess performance at a glance or communicate how well the space performs to someone who isn’t a specialist.
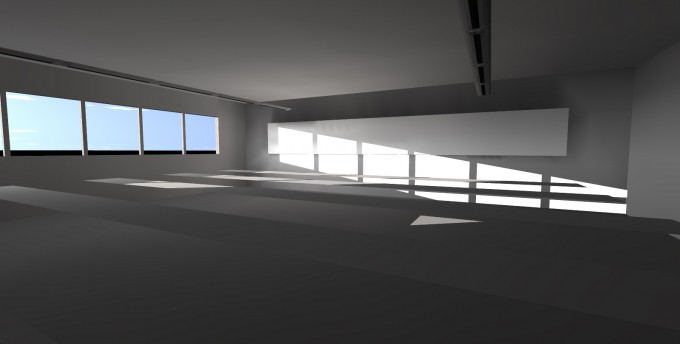
Daylight Glare Probability (DGP): Glare is when the ratio of luminances within the field of view of an observer exceeds the comfortable dynamic range of the eye, such that the highlights appear blindingly white, and details are obscured by stray light bouncing around in the eye. It’s a hard metric to quantify because it’s very dependent on the observer (personal preference and age), the position relative to sources and the specific task being performed, and can arise in a number of ways such as reflections from the sun or luminance ratios between windows and adjacent surfaces.
The reference method for glare assessment calculations is to generate an HDR image for the position in question for every daylight hour of the year, and then compare the luminance ratios and adjacencies to come up with a probability that an average observer at that point would find it objectionable. But, doing this for even a simple space with one observer position entails thousands of hours of calculation, so in practice a simpler method is necessary. Daysim is capable of assessing an optimized algorithm DGP for a defined viewpoint.
This is very much an area of active research, but a proposed metric for DGP in Wienold 2009, Dynamic Daylight Glare Evaluation, is below.
[table id=22 /]
Pros:
- Predicts potential glare issues directly by evaluating luminance ratios, rather than a proxy metric such as aSE.
Cons:
- Even with the simplified/optimized algorithm used in Daysim, it’s a very time-consuming calculation.
- The optimized algorithm does not incorporate peak glare from sources such as specular reflection or direct sunlight exposure on reflective surfaces, if I understand it right.
- Results are only for the location and orientation tested.
- Conceptually opaque, i.e. it’s hard to make a correspondence between the DGP number and what the specific qualitative problem is.
Our example: I wanted to try orienting the classroom to a west-facing window, and then run DGP for a ‘student’ position and a ‘teacher’ position in front of the whiteboard, but I couldn’t get Daysim to return a DGP in a reasonable amount of time. The computer ran for a full day without finishing (3.0 GHz dual-core processor, although it appears to only use one core for this calculation). I think that any metric that takes longer than 24 hours to calculate has a severely limited utility as a design tool.
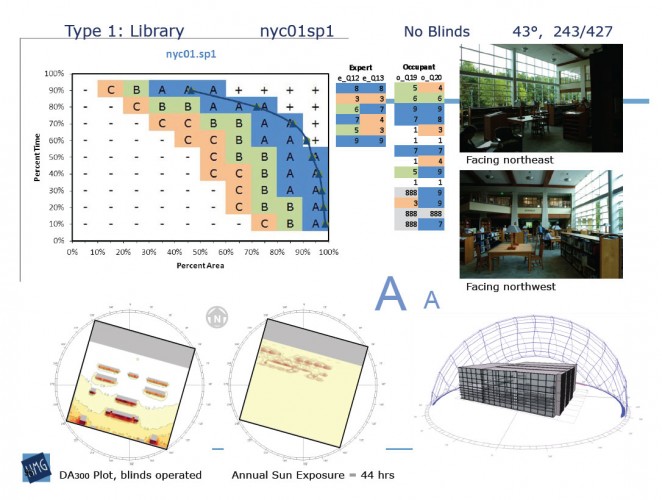
Annual Sunlight Exposure (aSE): is the number of hours per year at a given point where direct sun is incident on the surface. It has a great deal of import generally for heating and cooling, and is well-established in use for displaying artwork that the sun would damage. There are IES recommendations for how much annual light exposure artwork of various types may tolerate, in lux-hours.
In the forthcoming IES LM-83, aSE is defined as the percentage of square footage that has direct sunlight for more than 250 hours a year. Direct sunlight is abstracted as >100fc incorporating glazing materials, but not sky light, bounce light (radiosity), and not incorporating operable shades.
Pros:
- Fast to calculate, since it doesn’t require radiosity solutions or luminance maps for an observer point.
- Useful as a design tool, since it gives a good handle on where the problem areas might be of a design.
- Incorporates potential issues of thermal discomfort.
Cons:
- Does not address issues of glare due to specular reflections or veiling glare from high luminance ratios. aSE not, strictly speaking, a glare metric at all, it’s just a proxy that has been found to predict glare discomfort in many cases.
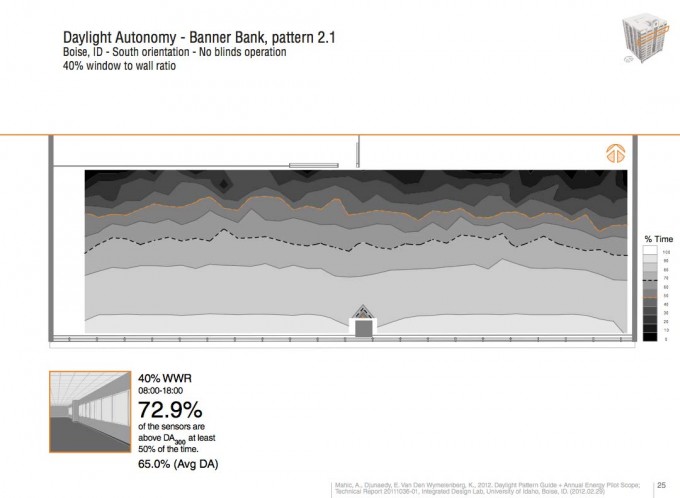
Our example: Since this standard is still under development, it’s not surprising that neither Daysim nor AGI has a pre-built configuration for it. For the north-facing window, the aSE would be 0 of course, since no direct light from the sun (not sky) would pass through the window. But, above is a slide from a recent lecture I attended with a similar space, at least in the sense that it has large north-facing windows. The A-B-C classification is a field study of how highly the occupants rate the quality of the daylight in the space vs. predicted quality via sDA and aSE, somehow? There were 150 slides, so some of it went by before I could really absorb it.
Spatial Daylight Autonomy (sDA): is another metric that is under active development, but it will described in IES LM-83, which is expected to be released later this year (2012). sDA is the percentage of area that is above 30fc 50% of the time or more during business hours.
Pros:
- Unlike Daylight Autonomy which returns an array of data points for every location in the space, it returns a single number for the space.
- Experimentally verified to predict occupant satisfaction, using a large study of 61 sites (forthcoming study by HMG group).
Cons:
- I don’t know if this is a drawback since it’s by design, but it’s worth pointing out that sDA does not incorporate glare or direct sun exposure– it is intended that aSE would be evaluated separately.
In Conclusion:
There are a number of discrete tasks that the daylighting consultant has to perform, such as comparing design variants for performance, selection of glazing and operable shading materials, and communication of the impact of design choices to other members of the design team. All of these metrics can contribute to some of those tasks, and which metric is optimal can depend greatly on the project geometry and location.
It’s an exciting time to be working in this field, because due to voluntary sustainable building initiatives such as LEED, there is a great deal of visibility for the benefits of daylighting, and I think we’re on the cusp of it becoming a design fundamental for most projects. Already, daylighting contribution is routinely considered in some project types, such as classrooms and airport concourses.
While my expertise is in electric lighting, I’ve been working on learning about this subject, because I think that the next generation of lighting designers will also be daylight consultants– the interactions between daylight and electric lighting are profound, and lighting designers are or at any rate should be already comfortable with running photometric simulations. I hope this was interesting and useful to you, please do drop me a line or comment if there’s anything you’d like to add! (or correct, of course)
